Overview
The selection binding techniques area already available in the Wave Analytics but it can be done only by using JSON. Now, without writing any piece of JSON code, we can easily bind more than one different dataset by using Connected Data source. Let’s see how to bind two different datasets using Data Source Connection.
Step1:
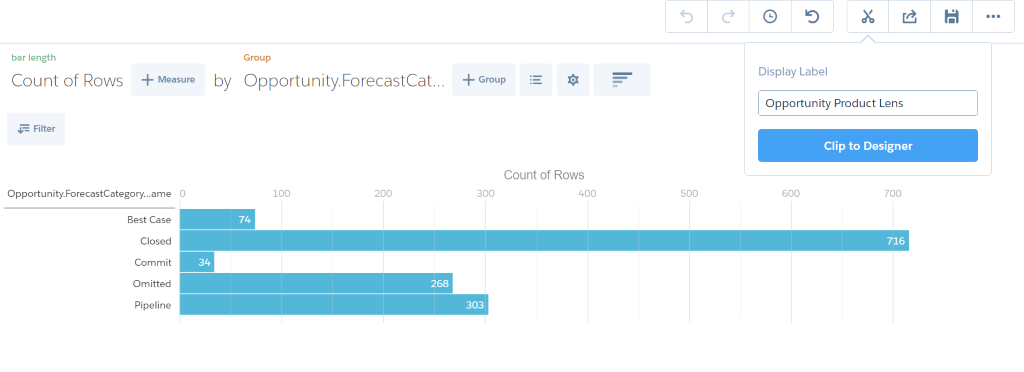
Dataset 1- Create a lens named “Filter by Forecast Category for Opportunity” by clicking on the Opportunity Dataset.
Click on the Group option and select Forecast Category Name field to group the picklist value.
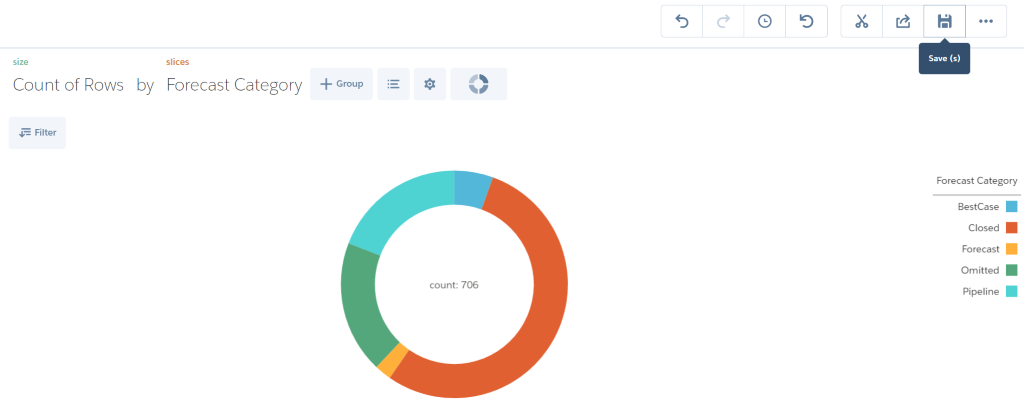
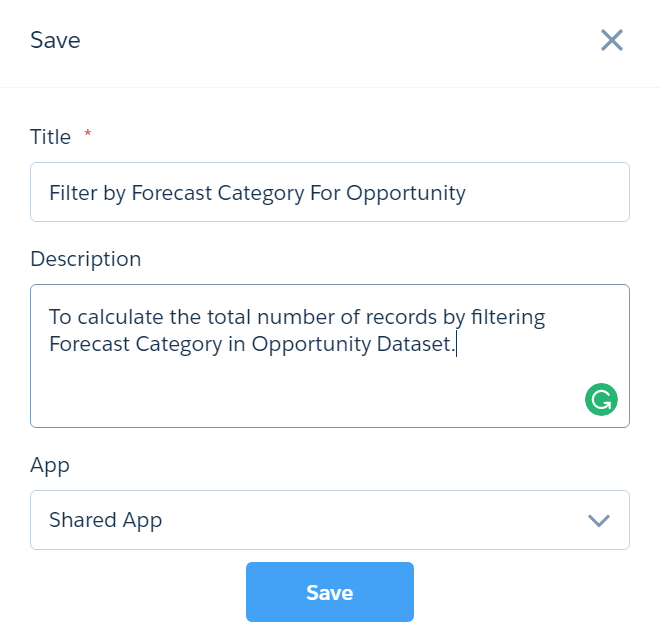
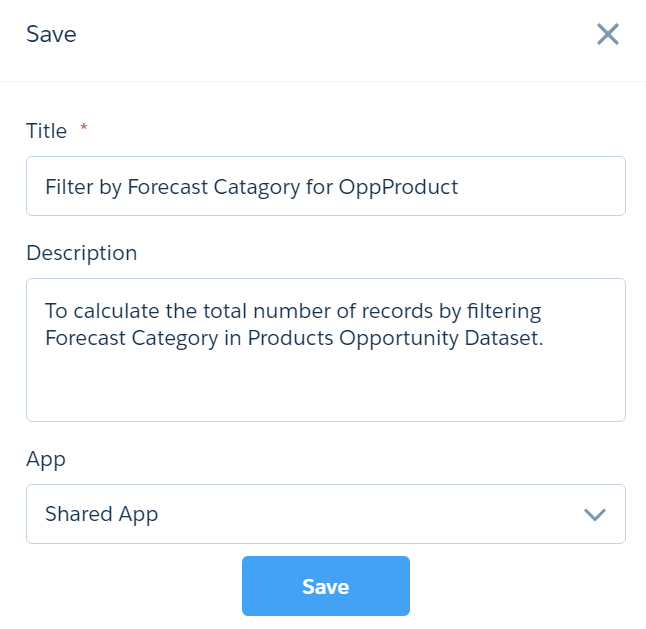
- Can view the specific record count based on the Forecast Category Field values. Finally, save the lens with the name of Filter by Forecast Category for Opportunity.
- Select the App already created in Wave Analytics. If we select the Private App, then it’s not visible to all the users but only the owner has access for it.
- Shared App is visible to all users available in the organization.
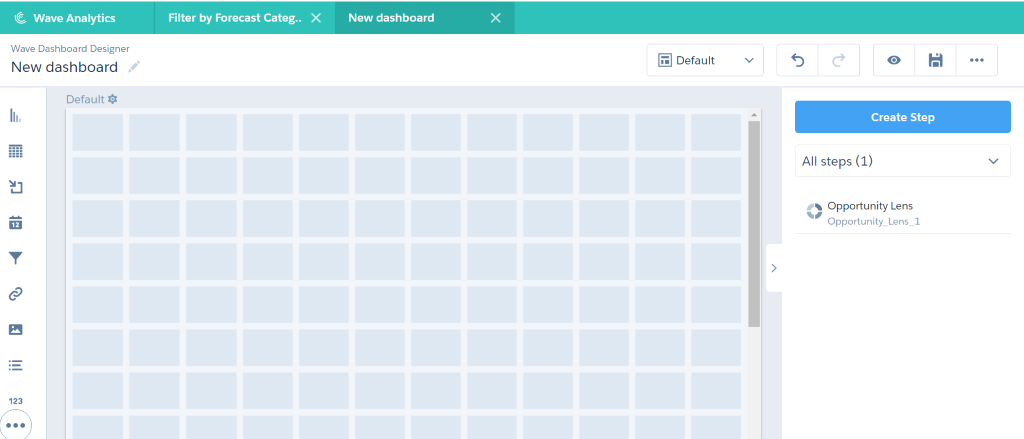
Click on the Icon to use this lens in new dashboard. Provide Display label name as ‘Opportunity Lens ‘and Click on the Clip to Designer.
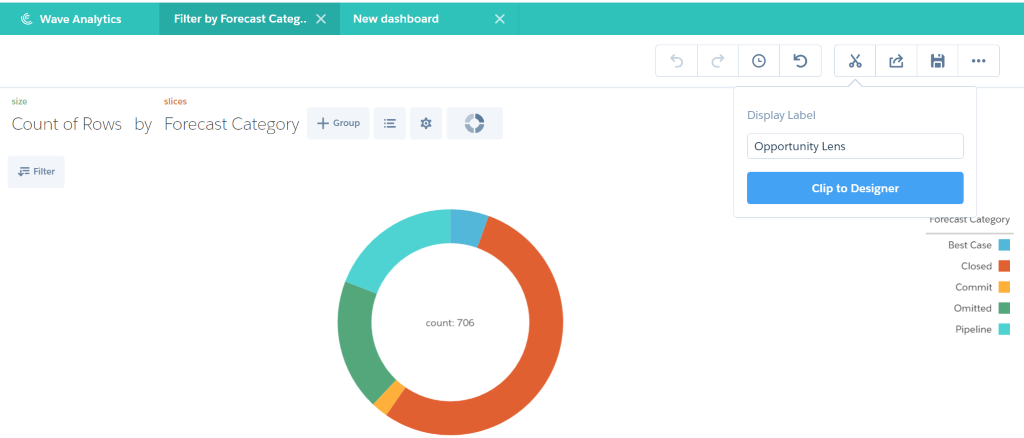
This lens is automatically added to the new dashboard under all step.
Step 2:
Dataset 2 – Create a lens named “Filter by Forecast Category for OppProduct” by clicking the Products Opportunity Dataset and group the Opportunities ForecastCategoryName field.
Choose the shared App to store this lens inside the app.
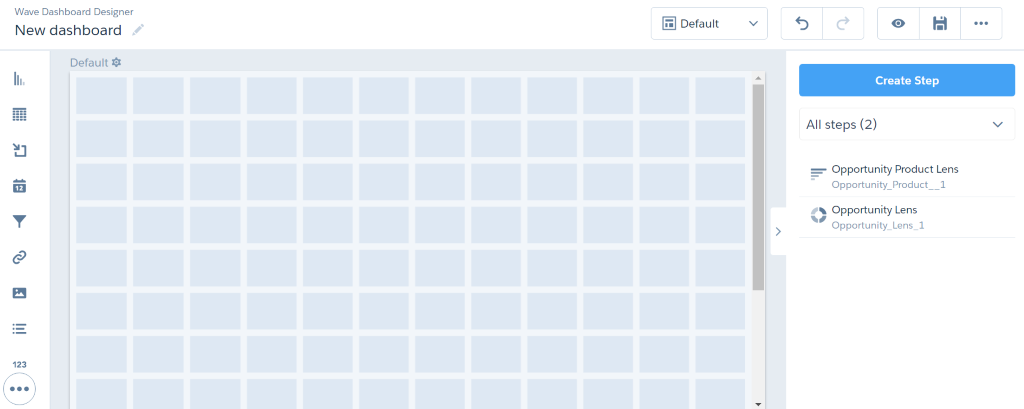
Click on Icon to use this lens in new dashboard. Provide Display label name as ‘Opportunity Product Lens ‘and Click on the Clip to Designer.
After the Clip to Designer is clicked, this lens will also be automatically added to the new dashboard.
Step 3:
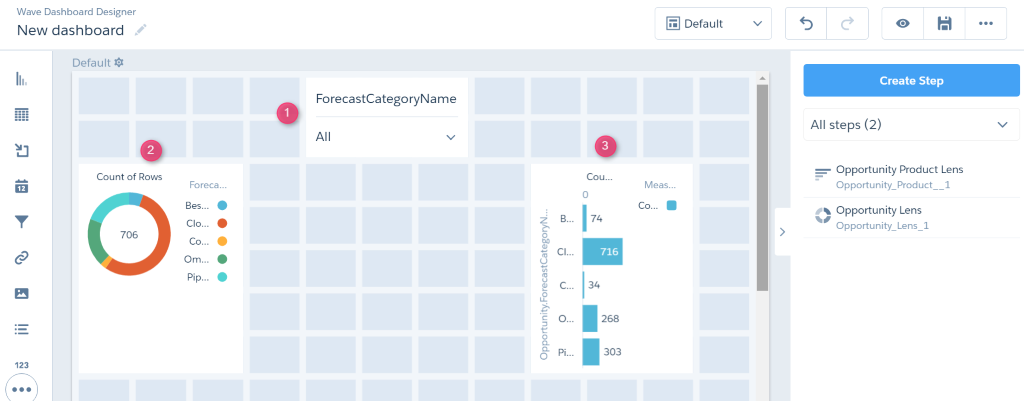
The following need to be added in the New Dashboard.
- Click on the Number list and drag and drop the Opportunity lens.
- Click on the Chart and drag and drop the Opportunity lens.
- Click on the chart and drag and drop the Opportunity Product Lens.
Step 4
In the right side of the Dashboard page, click on the Icon and select the Connect Data Sources.
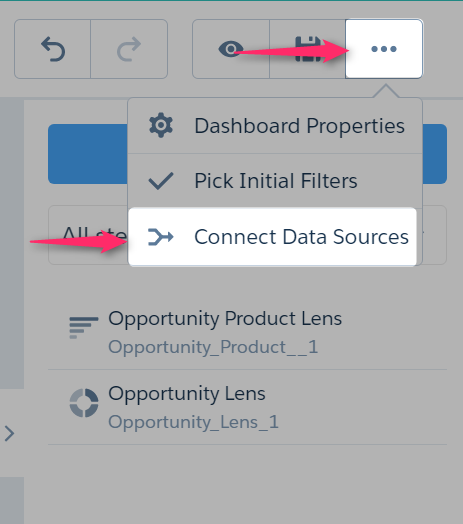
After clicking the Connect Data Sources Option, it will redirect to the following page.
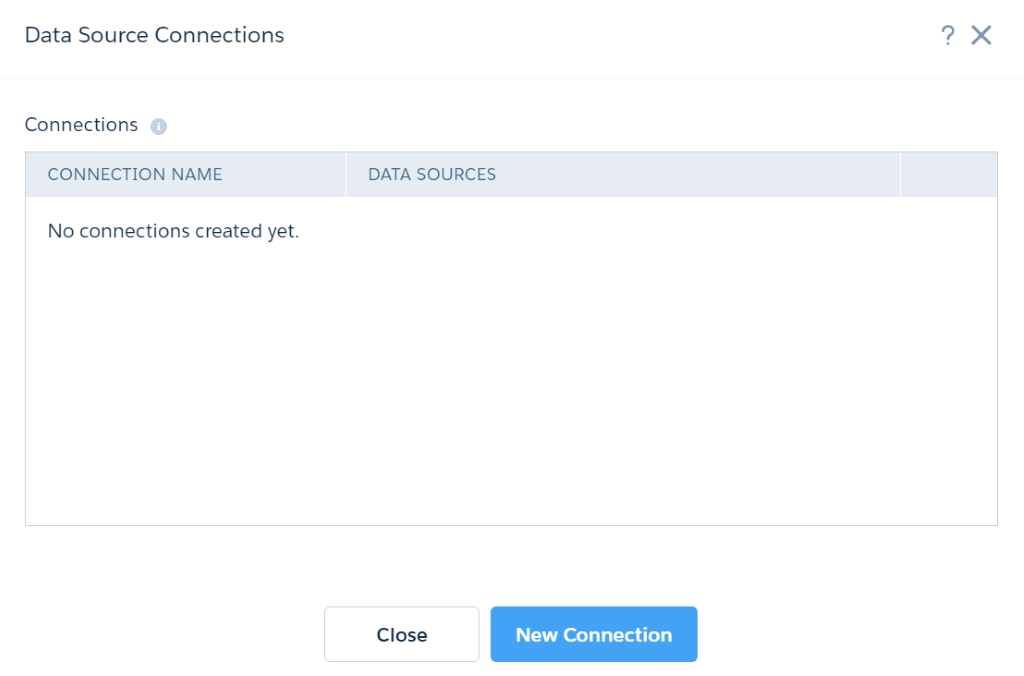
Step 5
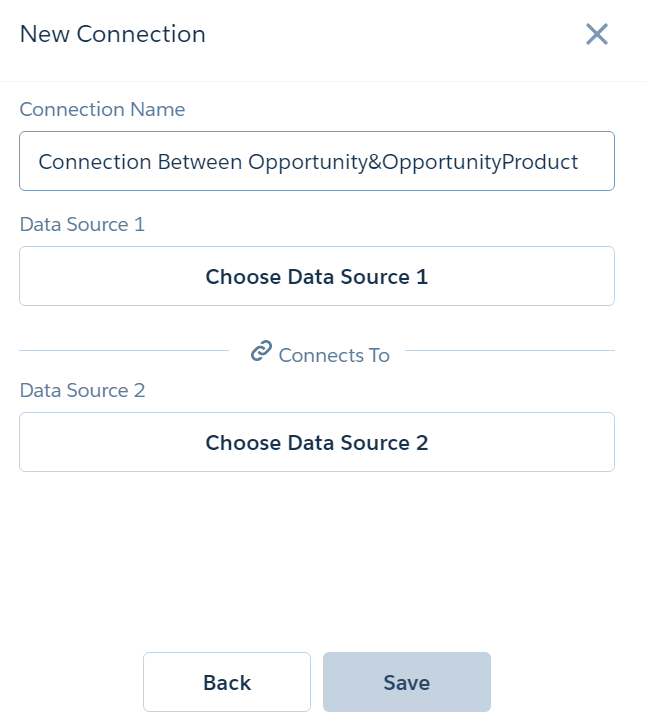
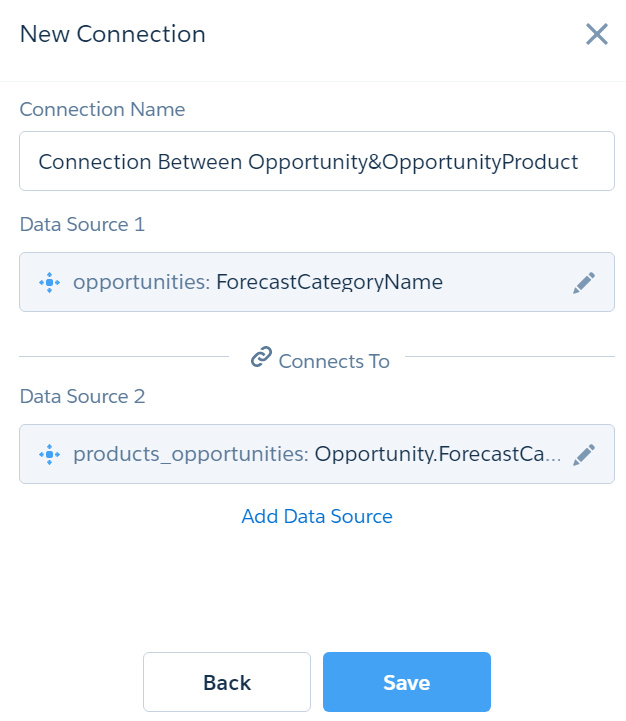
Click the New Connection button to establish a connection between two difference Datasets and provide label name as ‘Connection Between Opportunity & OpportunityProduct’.
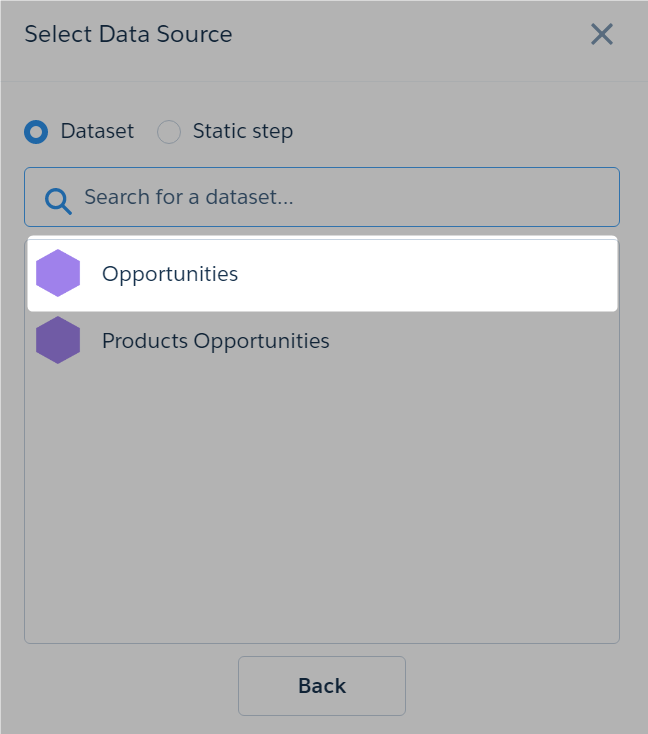
Step 6
Choose Data Source 1 and select the Opportunity Dataset.
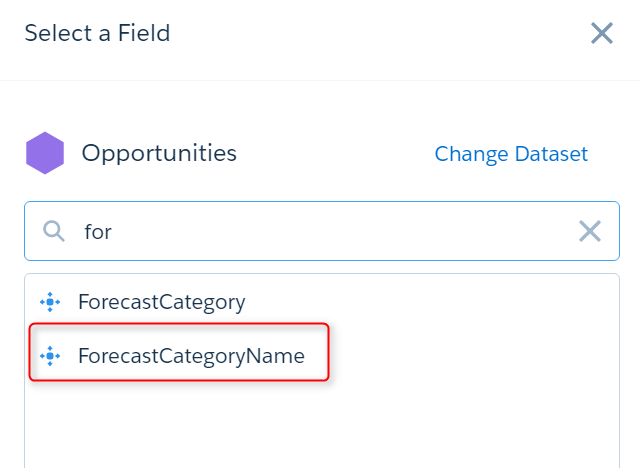
Step 7 – Select the common key in both Different dataset.
Select the ForecastCategoryName from Opportunity Dataset.
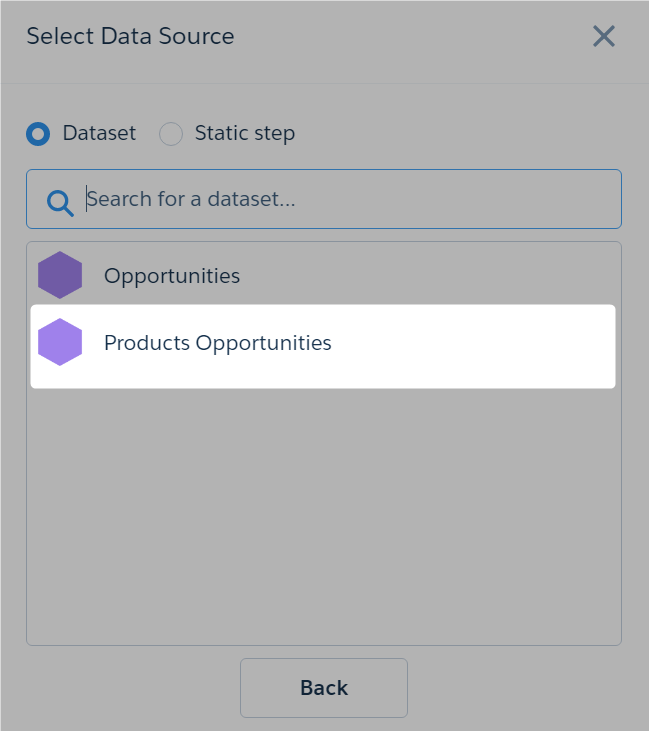
Step 8
Choose Data Source 2 and Select the Products Opportunity Dataset.
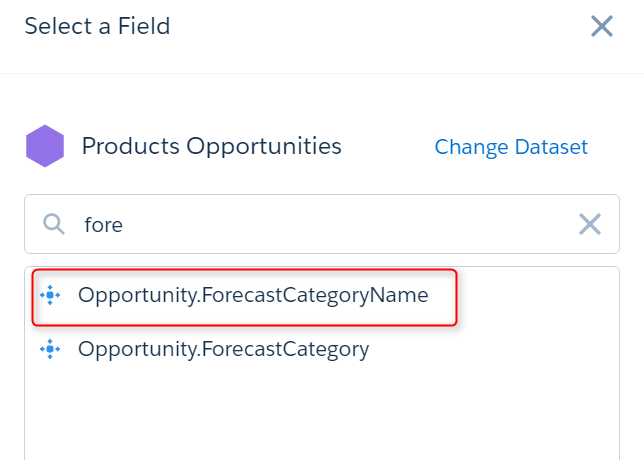
Step 9
Select the Opportunities ForecastcategortyName from Products Opportunity Dataset.
Step 10
Click on the Save button to commit the connection. Now, the connection has been established between the Opportunity and Product Opportunity Dataset with the common key as “ForecastCategoryName”.
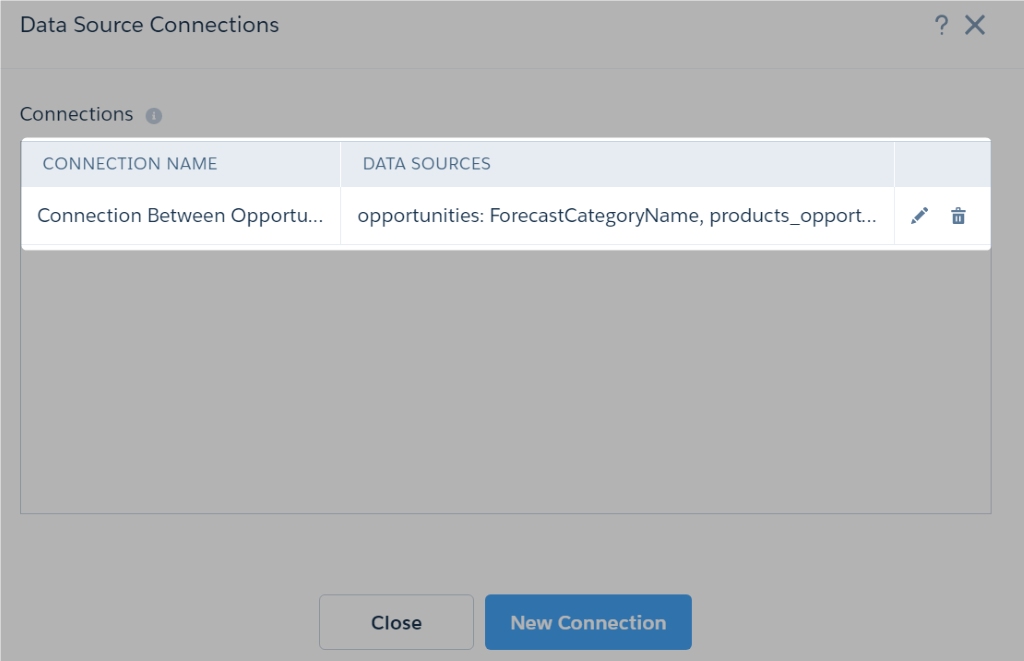
After the Save Button is clicked, it will redirect to the following detail page of the connection.
Step 11
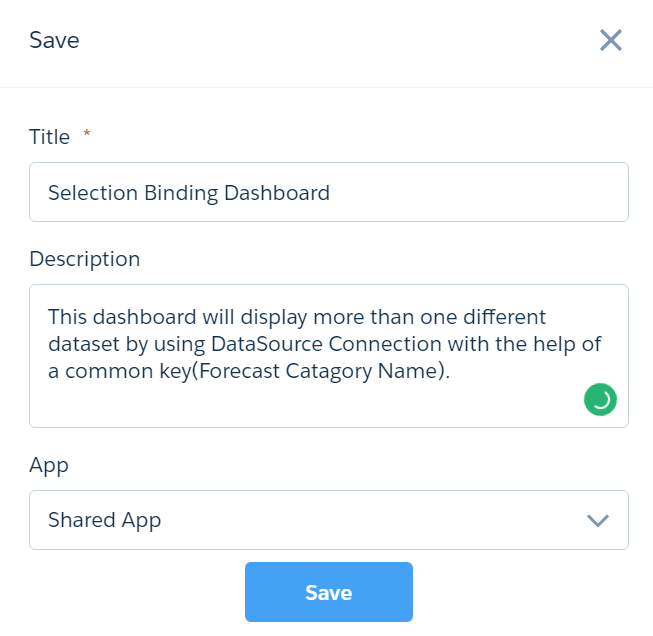
Finally, Save the dashboard with the appropriate name and description.
Step 12
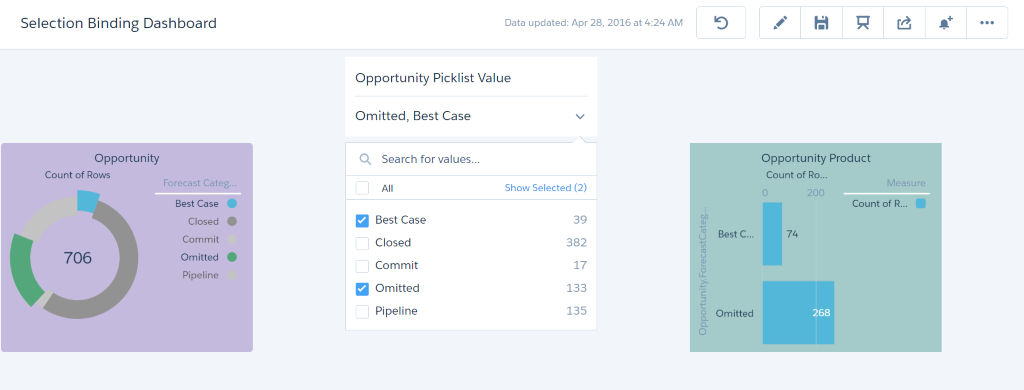
Before Creating Data Sources Connection:
- Here, the Best case and Omitted are selected in the Opportunity Picklist value drop-down list.
- Now, the Opportunity chart only highlights the specific record count and Opportunity Product chart doesn’t highlight the specific value rather it would highlight every picklist since it doesn’t have any connection between Opportunity and Opportunity Product.
Step 13
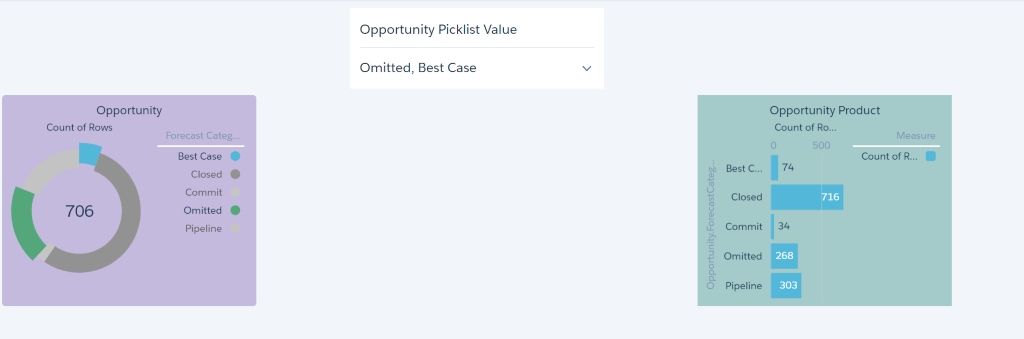
After Creating Data Sources Connection:
- If we select the Opportunity Picklist value (Omitted & Best Case) in dropdown list, the corresponding picklist value’s record count will be highlighted in both Opportunity and Opportunity Product Chart.
Advantages
- This can be easily achieved by point and click without writing any code.
- Takes less time to develop.
- Can create more than one connection for different datasets.
- Can maintain consistency across the dataset in organization.
Summary
- We have implemented the cross filter across different dataset in the organization with the help of Connection Data Sources Feature. Now, we can easily bind or link two different datasets without writing any code.
Reference Link: