INTRODUCTION:
- In this article, we are going to primarily focus on the Transform Node in the data Recipes.
- Before that, here is brief information about Recipes as this is one of the two primary ways along with Dataflows to create datasets to use in the Einstein Dashboards.
- Recipes are much simpler to develop and understand when compared to Dataflows, and we can preview the Data after each step in the recipes.
- In Recipes, there are 8 Different types of Nodes for various data manipulations. For E.g., Input Node to get the input data, Filter Node to filter the Data and one such Node is Transform Node which is the most important one.
- The Transform Node has several functionalities not provided by the other seven remaining Data nodes in the Data recipe like categorizing Column values, segmenting data into clusters, data type conversions and so on.
TRANSFORM NODE:
There are 14 types of transformations we can perform in the Transform Node:


- Bucket Transformation
- Cluster Transformation
- Data Type Conversion Transformation
- Detect Sentiment Transformation
- Drop Column Transformation
- Extract Transformation
- Edit Attributes Transformation
- Flatten Transformation
- Format Dates Transformation
- Formula Transformation
- Predict Missing values Transformation
- Split Transformation
- Time Series Forecasting Transformation
- Discovery Predict Transformation
- BUCKET.
- This transformation is used to differentiate common values in a data column into multiple categories like differentiating temperatures as high, moderate, and low.
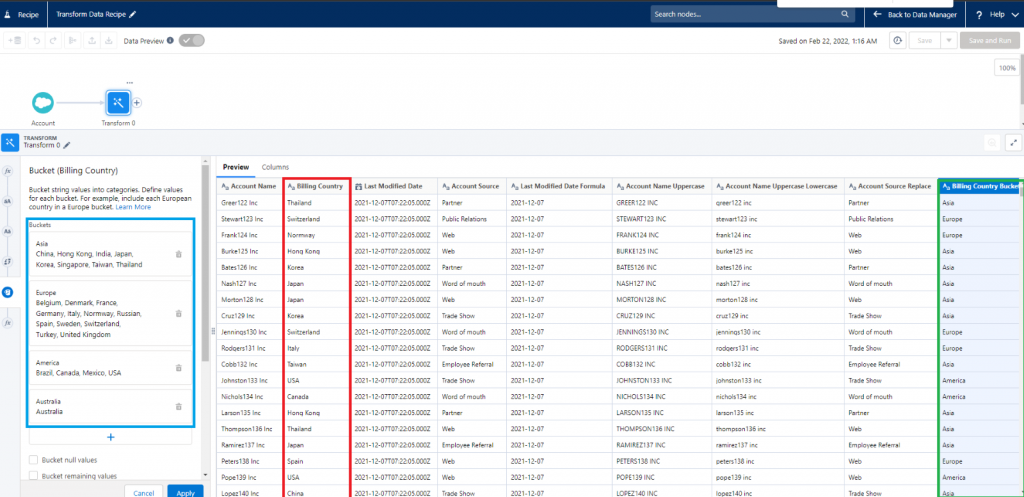
- In the below screenshot, we have an example where the column Billing Country (highlighted in Red) is categorized into four buckets with respect to their continents like Asia, Europe, America, Australia, etc and bucket values are displayed in a separate Column Billing Country Bucket (highlighted in Green).
- CLUSTER.
- This transformation is used to gather information from two or more fields and groups them into clusters.
- This approach is like Buckets but only difference is in buckets we segment the values from a single field into buckets but in clusters two or more fields are considered and clustering is done automatically.
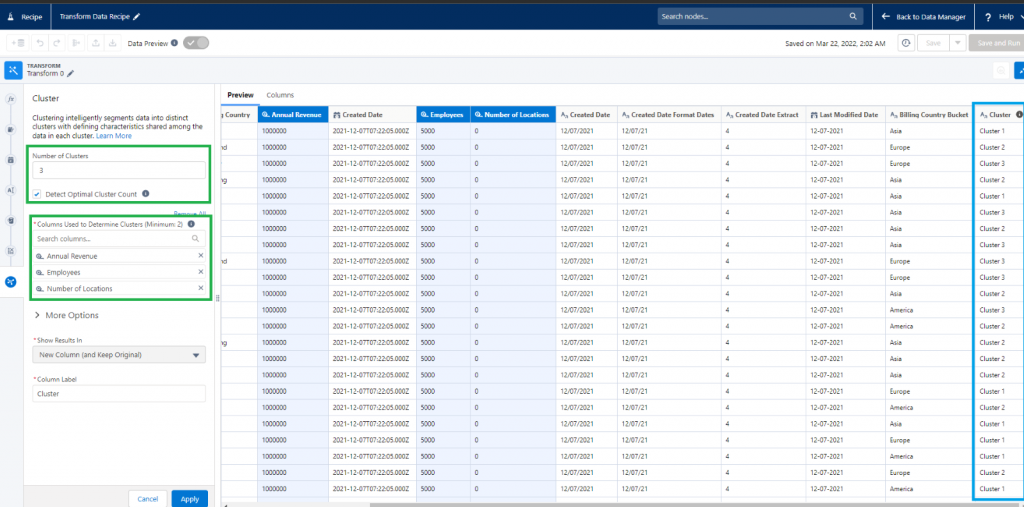
- In the below screenshot, you can see the attributes required while using Cluster Transformation like the Columns used and Number of clusters.
- DATA TYPE CONVERSION.
- Data in Einstein Analytics are divided into three Dimension, Measure and Date.
- Dimension data type refers to all data that is textual, picklist values and descriptions field values and so on.
- Measure data type refers to all numerical data like percentages, count and numbers, etc.
- Date data type refers to all values including date, time, datetime values.
- Data type Conversion Transformation is used to convert data in a data column into other two type of available data. E.g.: Converting Dimension to Date
- In the below example, Date in text is a text field (Dimension) is converted to Date type and displayed in a new data column (Date in text to Date).
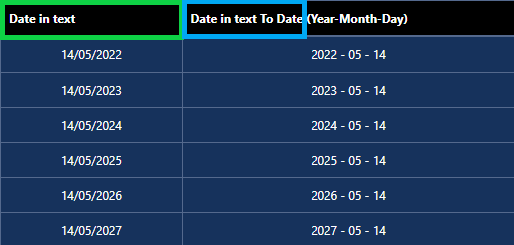
NOTE: Sometimes the converted data may not appear in the Preview screen of Transform Node; so, the above image is the lens of the Data recipe created because of the Data Conversion Transform Operation.
- DETECT SENTIMENT.
- This transformation is used to display feedbacks called “sentiments” based on the data being used in the recipe.
- The sentiments are displayed with the Salesforce AI Einstein which catches keywords in a data like in a review data, but this is also applicable for numerical data where the sentiments are generated based on different criteria.
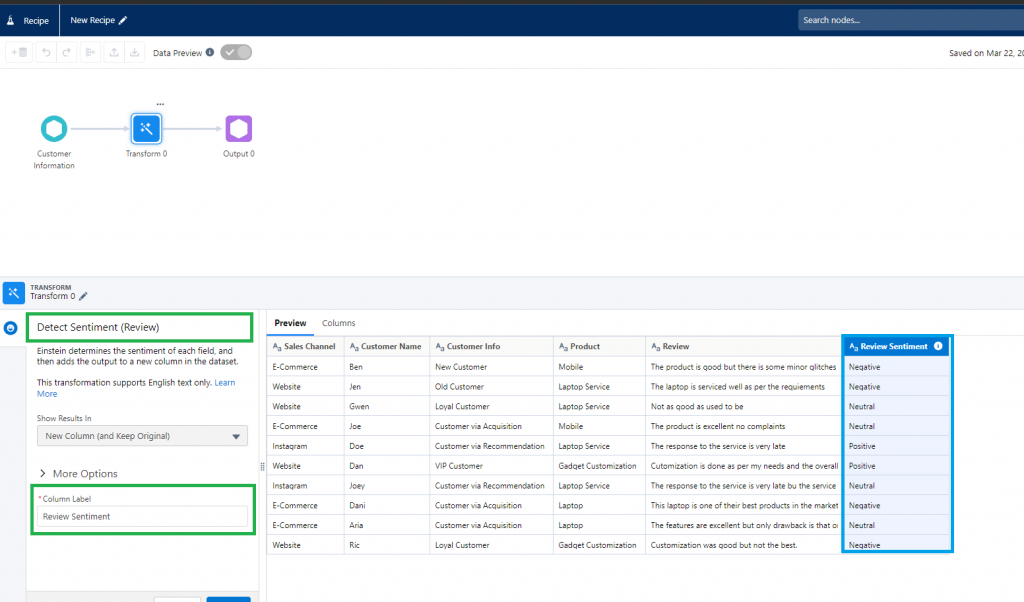
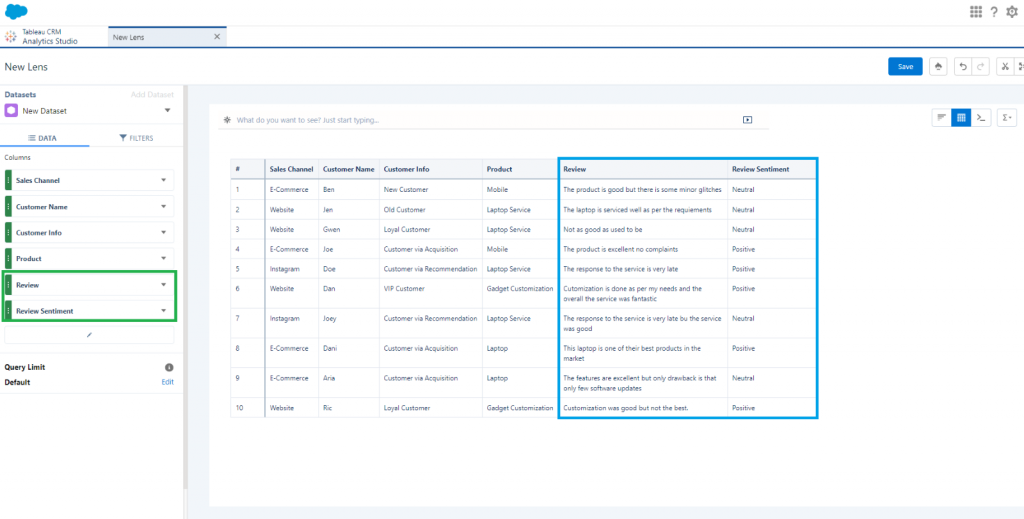
- In the below screenshot, we have used the Review column in the data recipe for sentiment generation but only sample values are shown in the recipe preview.
- To know the original values, we must view the resultant dataset from the recipe via lens as displayed in the below screenshot.
- DROP COLUMN.
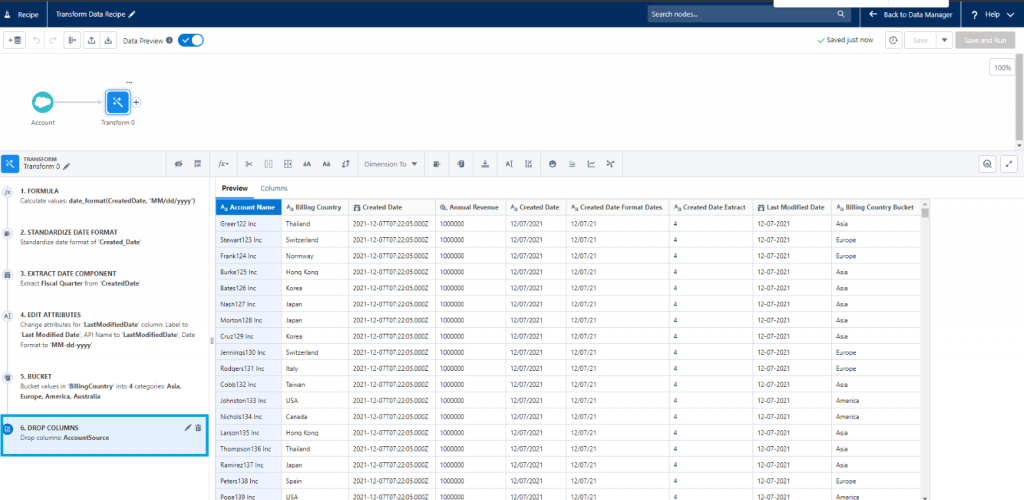
- This transformation is used to drop or keep columns based on their usability in the future data transformation in the Recipe.
- In the below screenshot, we have an example where the column Account Source is dropped as this column is not required.
- EXTRACT.
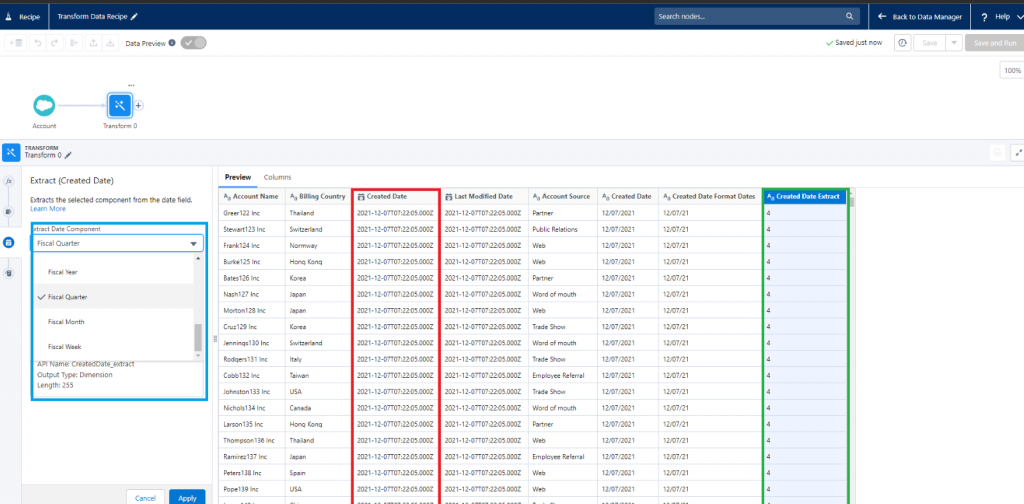
- This transformation is used to extract related data from a data column and displays it in a new data column like extracting Fiscal year form date column.
- In the below screenshot, we have an example where the fiscal quarter of Created Date (highlighted in red) column has been extracted and displayed in a new column Created Date Extract (highlighted in green).
- EDIT ATTRIBUTES.
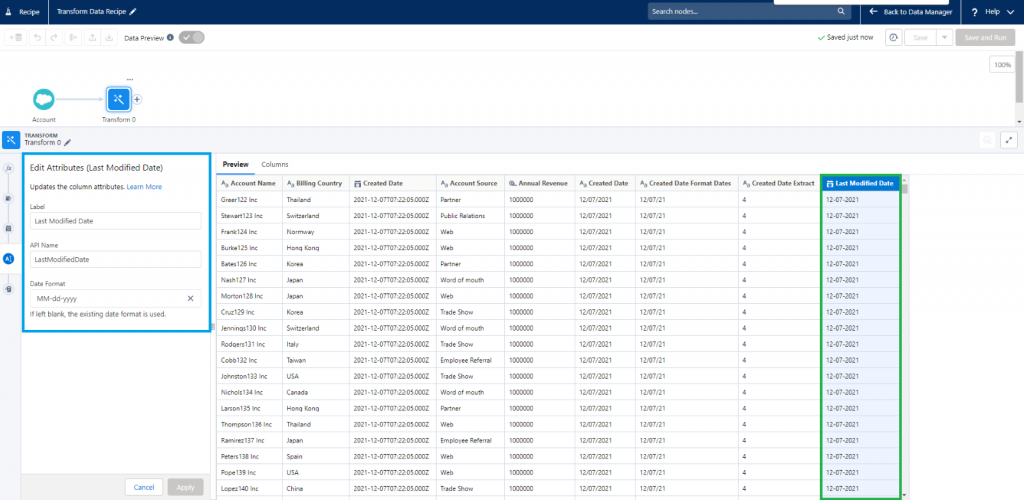
- This transformation is used to edit the attributes of displayed Data columns like Name, API Name common for all the columns but there are additional properties we can edit depending upon the type of data column such as Precision and Scale for Currency data columns, Length for text data columns, Date format for date columns and so on.
- In the below screenshot, we have an example where the format attribute of Last Modified Date column has been changed from Date time into new format (MM-dd-yyyy) (highlighted in green).
- NOTE: Attributes might change for each Data Column depending upon their datatype.
- FLATTEN.
- This Transformation is useful when we need to show the hierarchical path of a user role record like showing its parent and grandparent and so on.
- Format: child role/parent role /grandparent role.
- In the below screenshot, the flatten transformation is used between Role Id (child node) and Parent Role Id (parent node) fields (in Green) and displayed in a new column Role Path. The result of this transformation is displayed in two columns (in Blue) Role Id Path and Role Id Node.
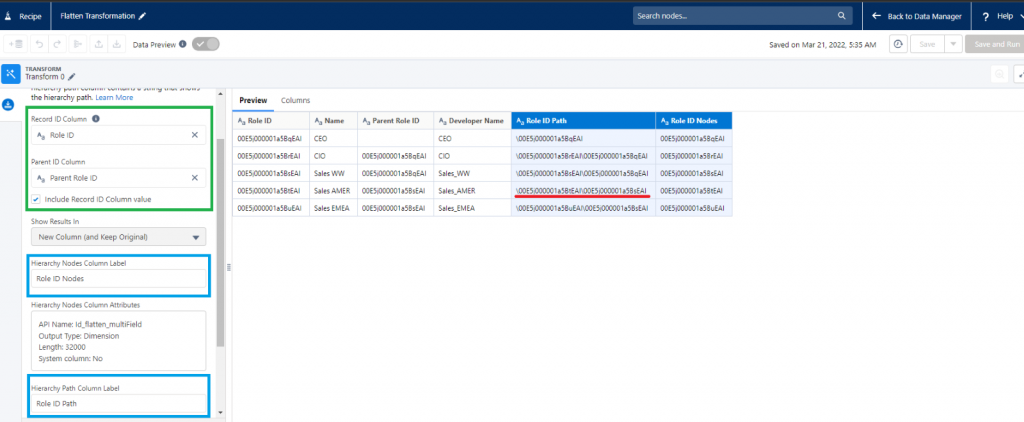
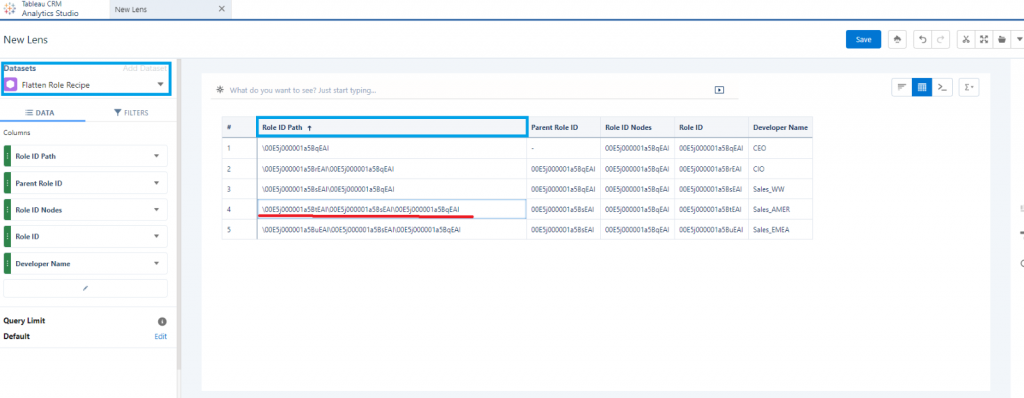
- In the preview of the data recipe, only the hierarchy extends up to 2 levels (In Red in above screenshot) till the immediate parent, but when we view the resultant dataset from this data recipe as a lens, we can see the entire hierarchy of a user role record as you can see in the below screenshot and table.
| ID | ROLES |
| Sales_AMER (Child Role) | 00E5j000001a5BsEAI |
| Sales_WW (Parent Role) | 00E5j000001a5BsEAI |
| CEO (Grandparent Role) | 00E5j000001a5BqEAI |
- FORMAT DATES.
- This transformation is used to manipulate the available data using custom formulas with the help of different types of functions like String functions, Numeric functions, Date/Time functions, Additional functions.
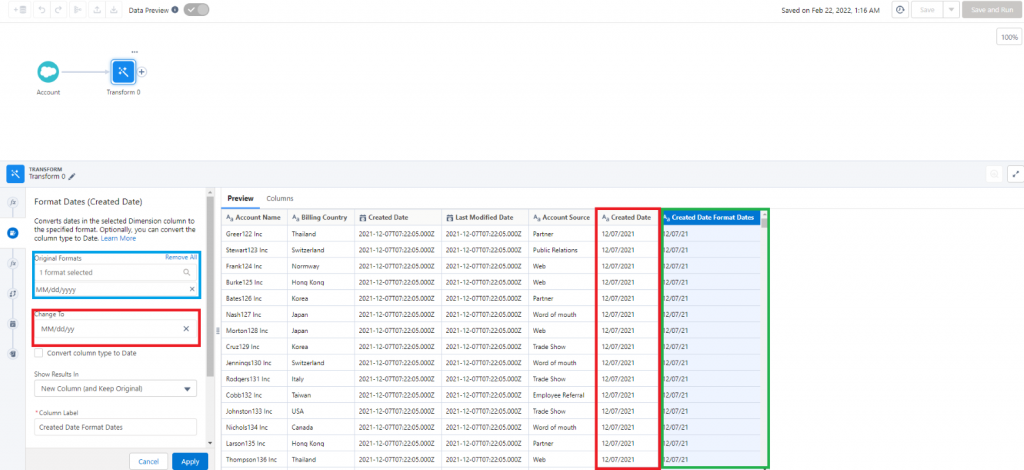
- In the below screenshot, we have an example where the format of Created Date (highlighted in red) column has been changed into new format and the data is displayed in a new column Created Date Format Dates (highlighted in green).
- FORMULA.
- This transformation is used to manipulate the available data using custom formulas with the help of different types of functions like String functions, Numeric functions, Date/Time functions, Additional functions.
- This function includes a formula editor just like in validation rules and Salesforce formula fields, etc
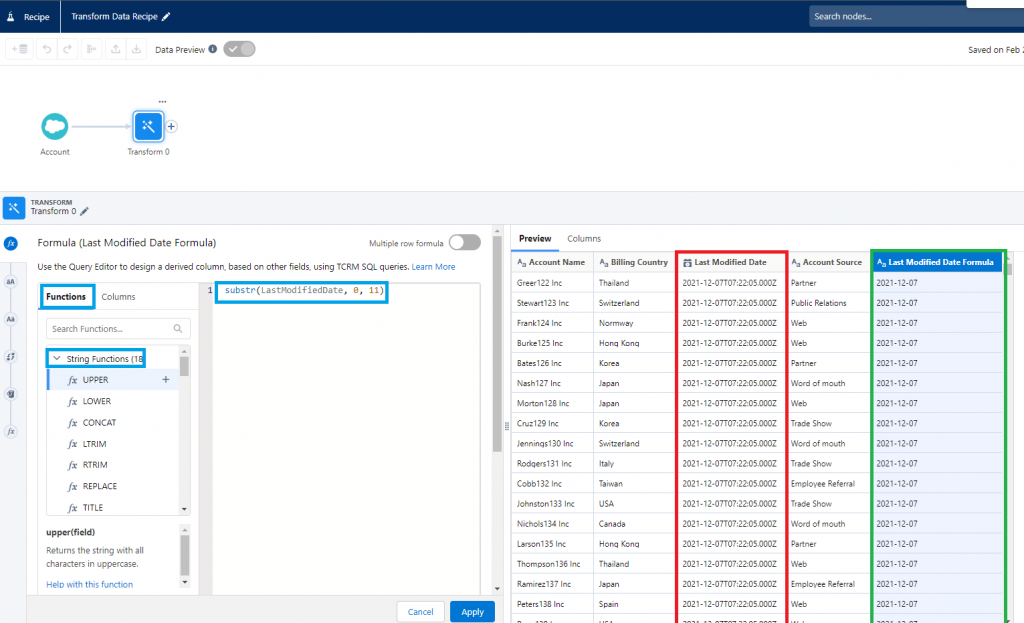
- In the below screenshot, we have an example where a formula is used to remove the timing from Last Modified Date field , and it is removed using a Substring Function and Displayed in a new Column (highlighted in green).
- This function is available for all data columns.
- PREDICT MISSING VALUES.
- This Transformation is used to predict missing values for a record in a data column based on other data the record currently has, but to make predictions there should be at least three data columns of Dimension data type in the recipe.
- This Transformation is different from Discover Predict Transformation where we must create an Einstein Prediction and then use that prediction in the Data Recipe Transformation.
- In the below example, we have created five Opportunity records with Type as Blank and we are using Opportunity Name, Stage and Amount Bucket (Derived Data Column) to predict the Stages of these five records.
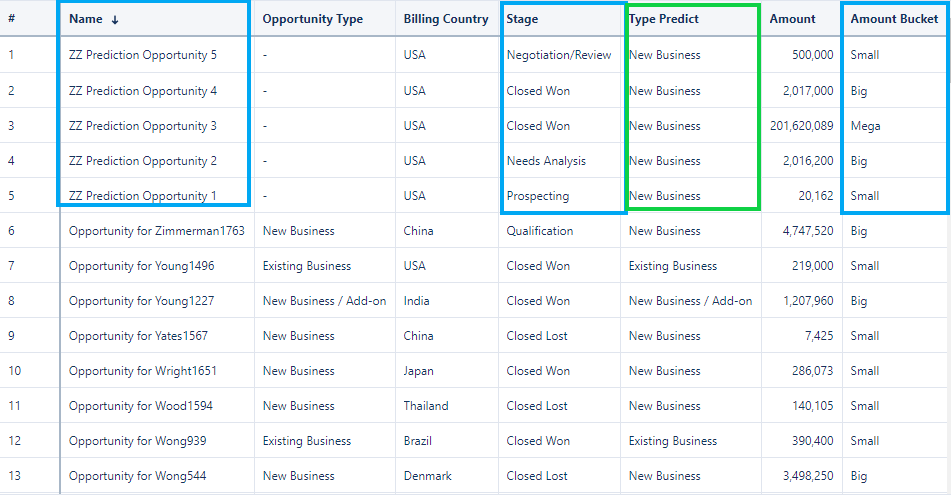
- To see the results of this Transformation, we must run the Recipe and view the result with the help of a lens

- SPLIT.
- This Transformation is like creating Substrings from a String, but the difference is that it separates the values in the data column into two separate Data columns at a specific delimiter or punctuation like a comma (,) or forward splash (/) and so on.
- This Transformation will be helpful in separating names of people and organization like First name, Last name and so on.
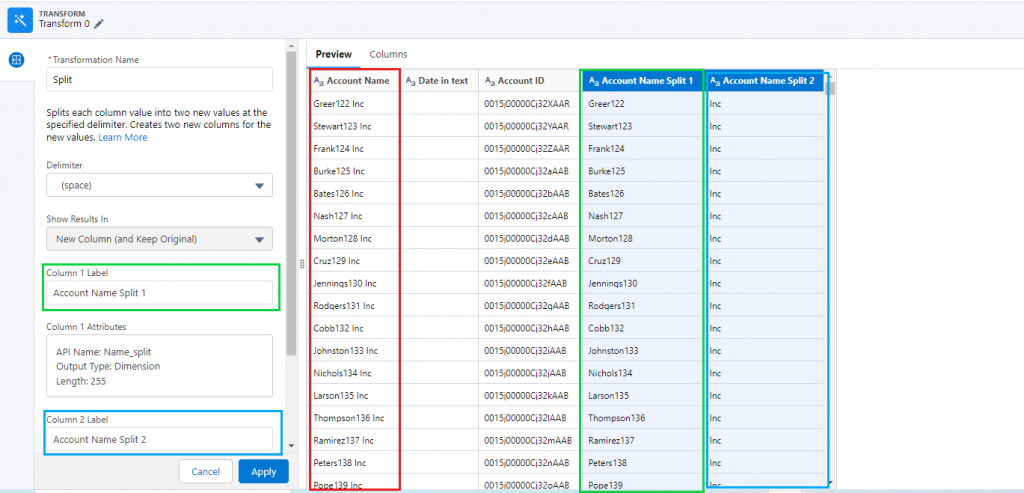
- In the below screenshot, we are separating values in the Account Name Data Column into two data columns at the space delimiter. If the Account Name is MST Solutions, it will get divided into MST in One Column and Solutions in Another Column.
- TIME SERIES FORECASTING.
- This transformation is used to provide values which we can expect in the future like weather forecast or stock exchange. We can have forecast length from 1 to 100.
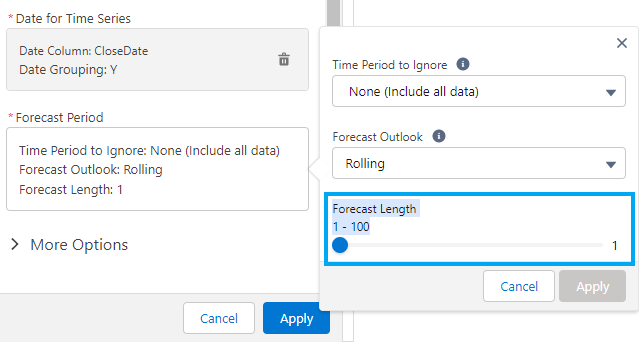
- There should be at least more than ten proper data rows with each row having a Date value and a Measure value in the Data Recipe for Einstein to provide proper values.
- This transformation can be used in scenarios to predict the annual revenue or growth of an organization for each fiscal quarter based on the previous data.
- This is not like Predict Missing Values transformation where we can find a missing value of a record, not the future values
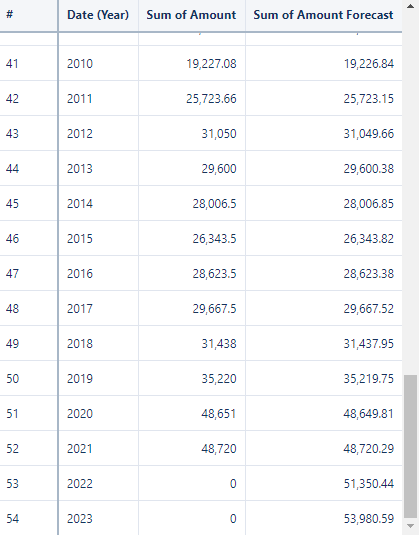
- In the below screenshot, we have used this transformation to predict values of 10gms of Gold for 2022 and 2023 based on the prices from previous years.
- DISCOVERY PREDICT PRANSFORMATION.
- This transformation does not come under the Transformations of Data Recipe data node because there is a separate node allocated to this Transformation.
- This transformation requires at least one deployed Einstein Prediction created matching the data columns to be used to get the AI predicted output.
NOTE: To work on Einstein Predictions, you must have an org where Einstein Prediction Builder is enabled.
For further information about this Transformation, please refer this article. https://help.salesforce.com/s/articleView?id=sf.bi_integrate_recipe_transformation_EinsteinPredict.htm&type=5


