Qlik Sense is a data analytics tool that runs in browsers as well as in desktops.
It’s a business intelligence tool. With help of this tool, we can create a report and dashboard easily. Also, it provides real-time analytics and transaction data for your entire enterprise all from within one dashboard.
How to install Qlik sense?
Click the below link to install Qlik sense
https://www.qlik.com/us/try-or-buy/download-qlik-sense
Fill in the form and click “Download Now” button to download the software. The software will automatically download. For more details to install Qlik sense click here.
Features:
Qlik sense has numerous features that are flexible enough for all types of users:
Responsive Design: It will automatically adjust the apps view, whether on desktop, tablet and smart phone.
Self-Service Creation: Drag and drop abilities offer easy dashboard and report creation without the need for scripting, complex queries or joins
Smart search: The search bar function allows you to type in keywords to quickly locate data sets, graphs/charts, reports and more.
Centralized management: Qlik Sense acts as one central location for users to develop and share apps, data stories and insights quickly and efficiently.
Follow the steps below to create a sample application using Qlik sense
Step1: Open the Qlik Sense by clicking the desktop shortcut or menu option
Step2: Click on the “Create a new app” option and give a name to the app. Step3: Now, the application will be open. Then, you can see the “Add Data” and “Data load editor” option
Step4: Drag and drop the excel file that contains the sample data onto the application.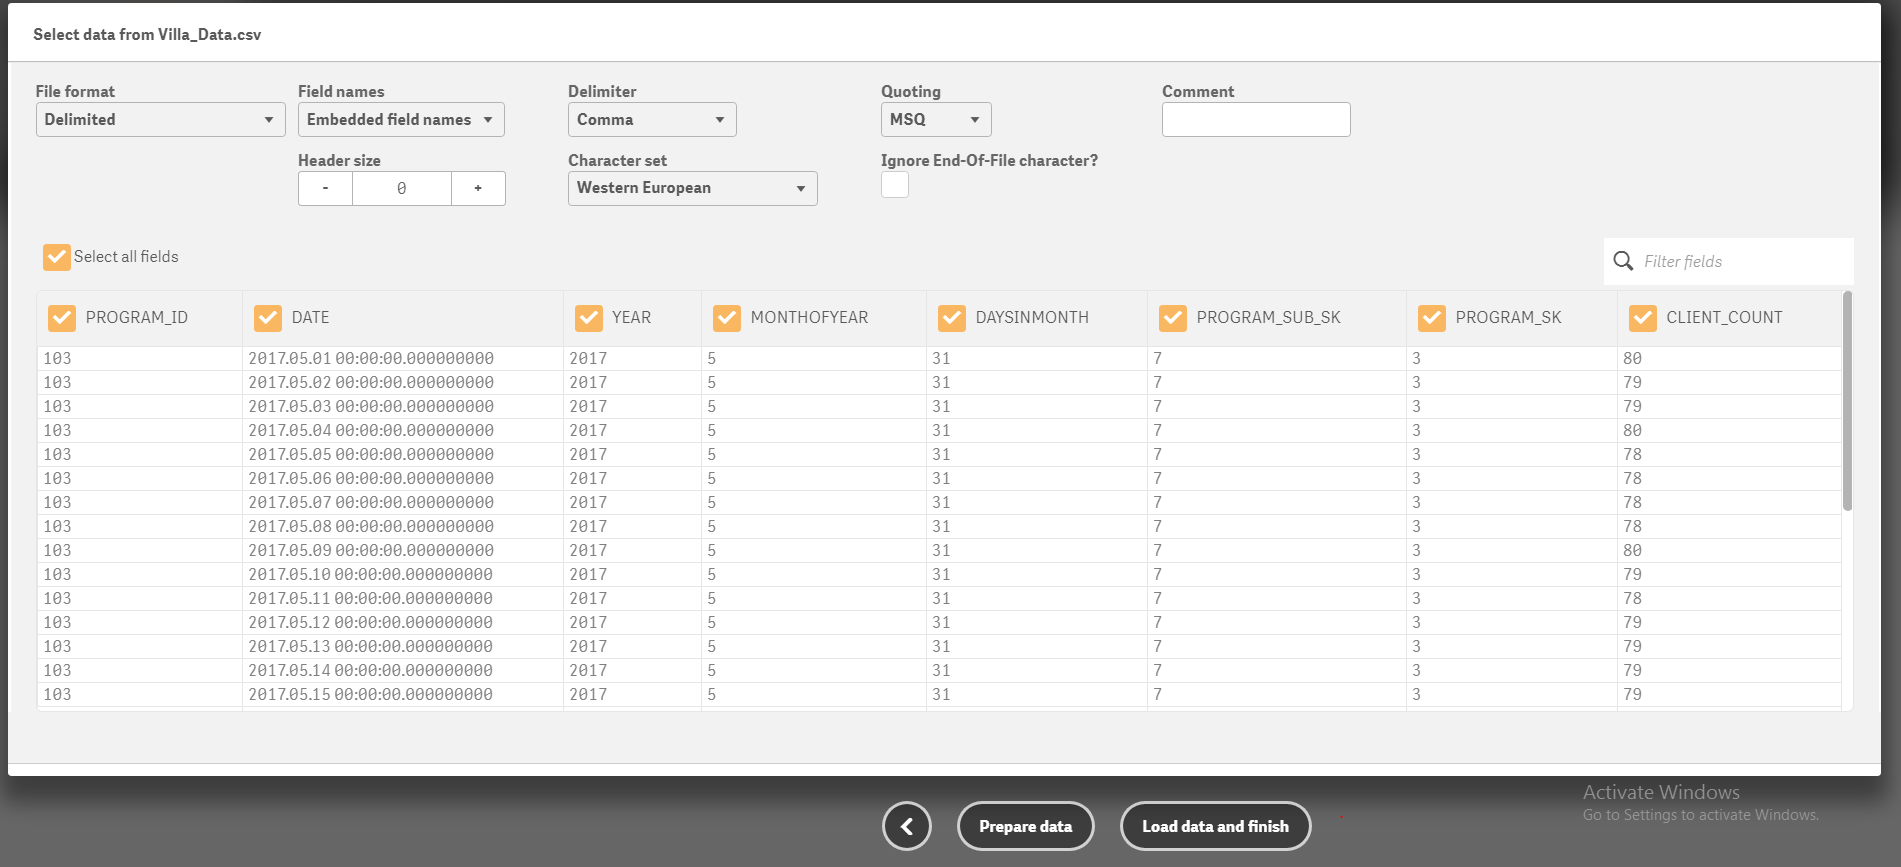 Step5: Click “Load data” button to loads the data from the excel
Step6: Then click “edit the sheet” button to begin creating your first sheet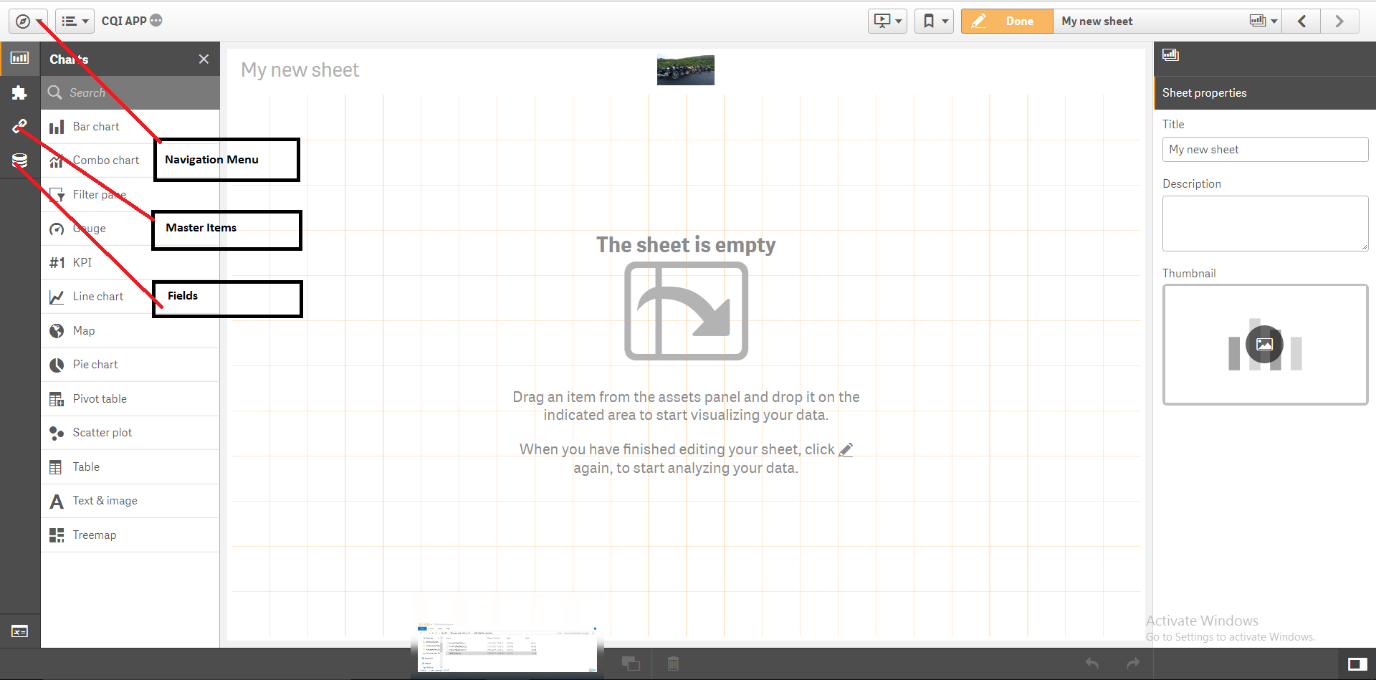 Step7: This has 3 main options shown in the above screen shot
Chart – Here you can drag the objects to the sheet
Fields – which shows all the available fields in the data model
Master Items – it will show dimensions, measures and visualizations
Step8: Drag and drop the ‘Bar chart’ in the middle part of the sheet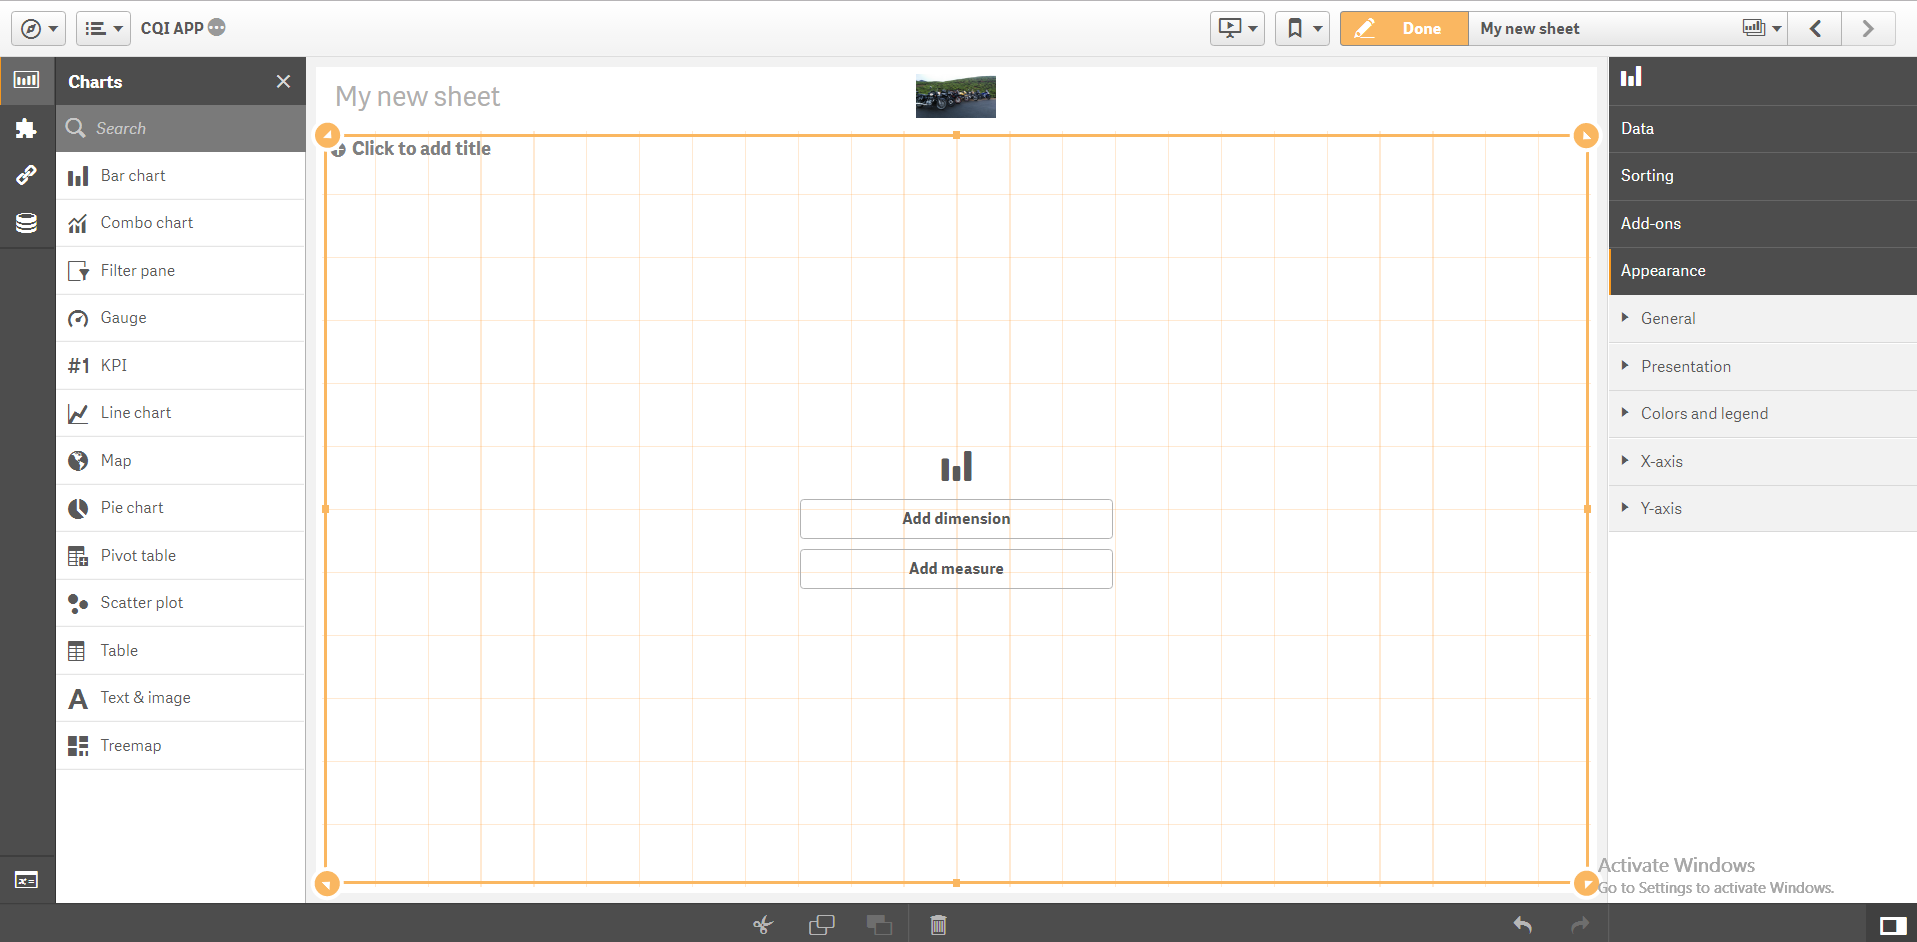 Step9: Click on the add dimension and add measure button to select the field.
Dimension and Measures will determine how the data will be grouped in the chart (x axis and y axis)
Step 10: After adding the x and y axis, click Done to view graph in the sheet
Now you can see the sheet that contains some data.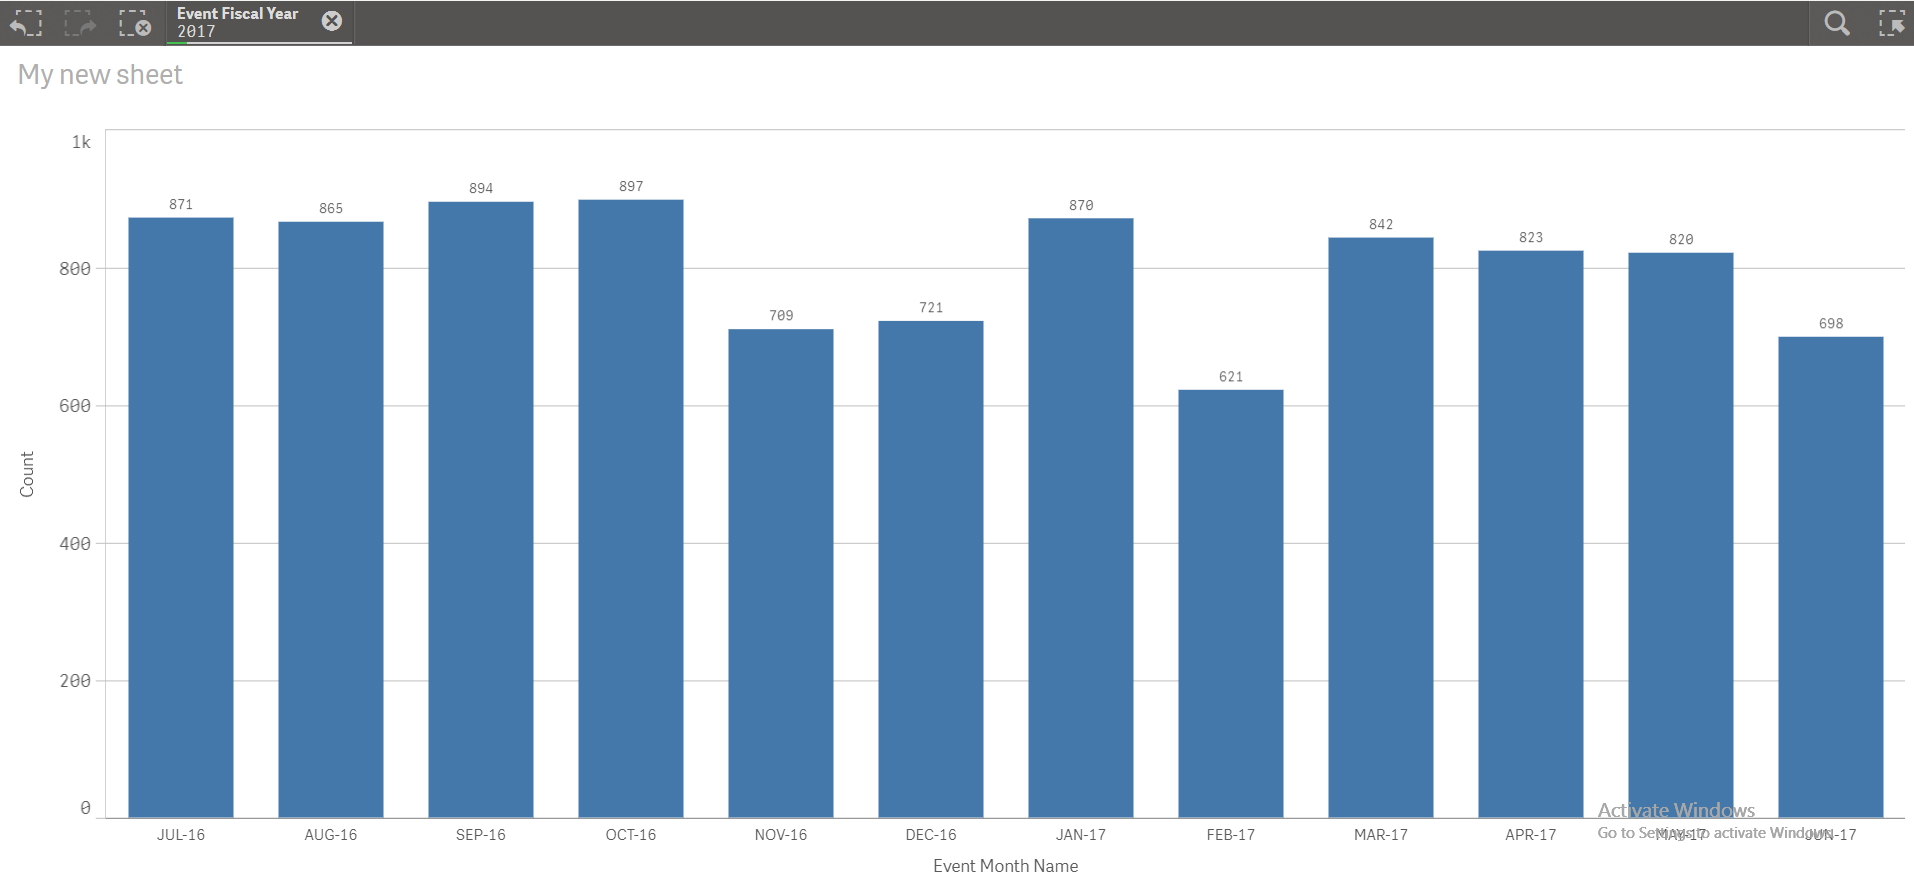 Reference Links: