Tableau:
- Tableau is a data visualization tool
- It simplifies huge datasets into a graphical representation, visualization created in the form of dashboards and worksheets
- It allows us to create a customized dashboard and easily connects with Salesforce.
Features:
- Creates Interactive Dashboards
Data in sheets and dashboards are connected. When modifying a sheet, all dashboards contain the data change, and vice versa. Both sheets and dashboards update with the latest available data from the data source.
- Embeds Dashboards within HTML Document and Salesforce Org
Embeds interactive dashboards into web pages, blogs, wiki pages, web applications, Salesforce Org and intranet portals.
- Tableau Public:
To share the data discoveries outside of the organization, the dashboards must be saved under Tableau Public which is a free cloud service. It helps that anyone can interact with the views, download the workbooks or data sources.
Tableau Types:
Tableau has two types:
- Tableau Server
- Tableau Desktop
Tableau Server
Tableau Server is installed on a Windows server and available to users through a browser. In Tableau Server, the administration team must provide the web-edit privilege to users or groups to enable web authoring. Once the users have permissions, they will be able to create new workbooks from published data sources or modify existing workbooks.
Tableau Desktop
The workbooks and the dashboards are shared either locally or publicly. Tableau Desktop has different connectivity and publishing options, based on these options it is categorized into
- Tableau Desktop Personal – The dashboards cannot be published online. Therefore, it should be published either Offline or in Tableau Public.
- Tableau Desktop Professional – The dashboards can be published either online or in Tableau Server.
Tableau classifies the data in two different types
- Dimensions
- Measures
Dimension:
It contains qualitative values and these values can be a place, a thing, a person, ID, date, Boolean, etc., and use the dimensions to categorize data.
Measure:
It contains numeric and quantitative values. Measures can be aggregated. When dragging a measure into the view, Tableau applies an aggregation to that measure by default.
Examples:
Dimensions:

Measures:

I. Connecting with Salesforce:
Step 1: Download and Install Tableau and create an account. Download and install Tableau on your computer.
Step2: Connect to the Salesforce Org using the steps below
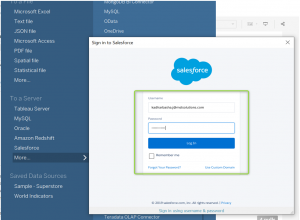
Open Tableau and choose “Salesforce” under “To a server” which can be found below “Connect”.
Step 3: Provide your Salesforce credentials in the pop-up window
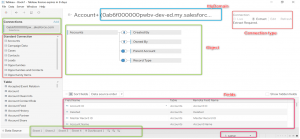
- After connecting with Salesforce, it lists the salesforce objects in the tableau desktop.
II. Creating a Dashboard in Tableau Desktop:
Step 1: Drag and drop any of the objects for which we need to create a dashboard from the Standard Connection Pane in the Left side to the canvas.
Step 2: The selected object’s related objects and some of the fields will be displayed in the canvas after Step1. Unwanted related objects or fields can be removed by right clicking the component and clicking Remove option
Step 3: Before switching from data source to Sheet1 (in bottom tool pane) ensure that Connection status (at the top right corner) is set as Extract.
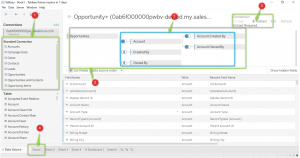
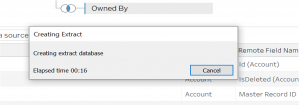
Step 4: Click Sheet at the bottom of a tableau. After clicked, the system will fetch the records from the Salesforce database as shown in the below fig.
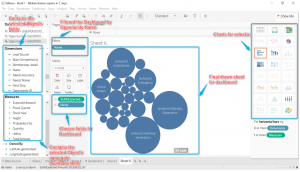
Step 5: Add fields from Dimensions and Measures
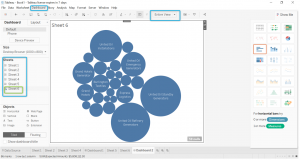
Step 6: After creating the sheet, place it in the Dashboard. Navigate to the Dashboard tab (top tool pane) à New Dashboard. Once the dashboard window opens, choose the sheet from the left tool pane for which the dashboard needs to be created and set the view as Entire View as shown below.
Step 7: Publishing Dashboard
Click Server tab (top tool pane) à Tableau Public à Save to Tableau Public
After the above step, a popup will be displayed as below asking for the Tableau Public Sign-in Credentials,
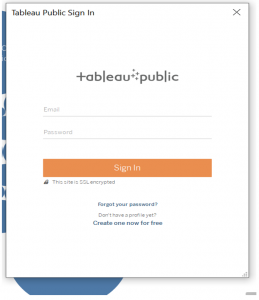
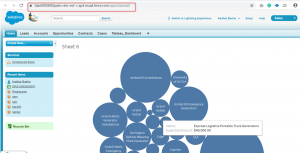
After entering the Credentials, the dashboard will be published as shown in the below fig.
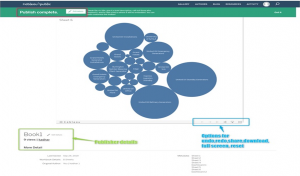
In the above picture, the published dashboard and the publisher details will be displayed along with the options of Undo, Redo, Reset, Share, Download.
Share:
Under Share, there are two options,
- Embedded code – Used to add the dashboard into an HTML.
- Link – Used to embed the dashboard into Salesforce.
III. Display the Dashboard into the salesforce Org:
There are two ways to add the dashboard in Salesforce Org,
1.Web Tabs
Step 1: Copy the Link after clicking the Share option in the dashboard
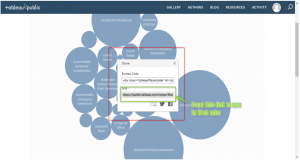
Step 2: Log into Salesforce
Setup à Tabs à Web Tabs à New
Proceed further as shown in the below pictures.
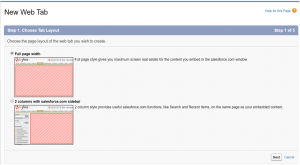
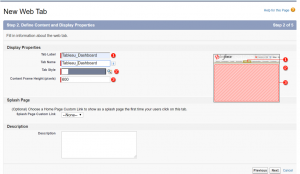
The below figure represents the pasting of the copied link from Step 1.
Here, along with the copied link some piece of key words highlighted needs to be added in the middle of the link as shown below,
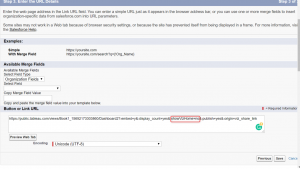
Step 3: Finally, click the Save button
Step 4: View the tab in the App as chosen during saving the Web Tab.
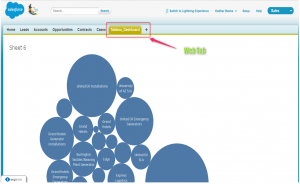
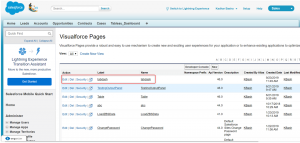
2.VF pages
Step 1: Open Developer Console and create a new VF Page
Step 2: Add the Apex iframe tag.
Step 3: For src value in the tag below, paste the same link which we copied and used for “Web Tab”.
<apex:iframe src=”https://public.tableau.com/views/Book1_15692173303860/Dashboard2?:embed=y&:display_count=yes&:showVizHome=no&:publish=yes&:origin=viz_share_link”/>
