The Lightning Component framework is a UI framework for developing dynamic web apps for mobile and desktop devices. The framework is built on the open source Aura framework. It is used mostly for single page application(SPA).
After developing an application, if the developer needs to debug the lightning components we must follow the below steps.
Step 1: To enable debug mode for your organization (From Setup > Lightning components > Enable lightning debug mode). After enabling this option, it is easier to debug JavaScript code in your lightning components.
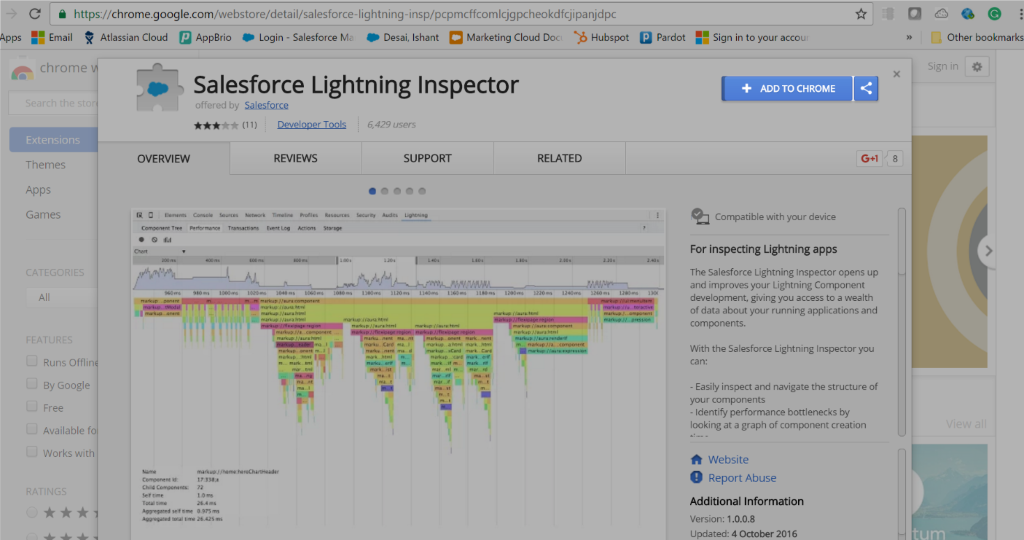
Step 2: To install Salesforce Lightning Inspector in your google chrome navigate to the https://chrome.google.com/webstore/detail/salesforce-lightning-insp/pcpmcffcomlcjgpcheokdfcjipanjdpc and click the ADD TO CHROME button.

Step 3: Now, browse to a lightning application in google chrome. You can see the Salesforce Lightning inspector adds a tab in your Chrome developer tools(F12). Also, you could see different subtabs to inspect different aspects.

Step 4: There are some tabs available, and it is listed below
- Component Tree Tab
- Performance Tab
- Transactions Tab
- Event Log Tab
- Actions Tab
- Storage Tab
Step 5: To debug your JavaScript code, for example while clicking the button, we want to check the functionality inside your method by using use “debugger” keyword. Simply add it wherever you want in your code.
Step 6: After placing the debugger inside your method, the inspector will stop running your code when it reaches to the “debugger” keyword.

Step 7: Then, we have an option to print log messages using JavaScript, and console.log (). In console tab, we will check the log messages of the Lightning components.

Reference Links:


